Welcome to Institutional Effectiveness (IE)
IE is dedicated to advancing Iowa Western’s mission, vision, and core values through data-driven decision-making and continuous improvement. Our major projects include accreditation compliance, program review, assessment, comprehensive reporting, and data projects. We want to make data easily accessible and usable for everyone.
Data Dashboard
Official Credit Full-Year Enrollment
| Year | Head Count | % Change | Credit Hours | % Change |
| 2024 | 8740 | 5.20% | 120271 | 5.00% |
| 2023 | 8308 | 1.20% | 114574 | -3.00% |
| 2022 | 8210 | -1.80% | 118061 | -1.10% |
| 2021 | 8357 | -6.90% | 119365 | -4.10% |
Percentage Change in Head Count
IWCC 5-Year Average: -0.70%
State 5-Year Average: -1.60%
Percentage Change in Credit Hours
IWCC 5-Year Average: -0.90%
State 5-Year Average: -1.40%
Fall & Spring Head Count by Year


Joint Enrollment
| Year | Head Count | % Change | Credit Hours | % Change |
| 2024 | 2941 | 4.10% | 33820 | 12.80% |
| 2023 | 2824 | 8.00% | 29992 | 10.50% |
| 2022 | 2615 | 0.90% | 27148 | 6.70% |
| 2021 | 2594 | 0.60% | 25452 | 2.20% |
Percentage Change in Head Count
IWCC 5-Year Average: +3.30%
State 5-Year Average: +1.30%
Percentage Change in Credit Hours
IWCC 5-Year Average: +8.00%
State 5-Year Average: +3.30%
Graduation, Transfer & Success Rates
| Year | Graduation Rates | % Change | Transfer Rates | % Change | Success Rates | % Change |
| 2024 | 42.80% | -0.60% | 31.30% | 1.10% | 54.80% | 0.20% |
| 2023 | 43.40% | 7.30% | 30.20% | 2.60% | 54.60% | 7.20% |
| 2022 | 36.20% | 3.10% | 27.60% | -1.30% | 47.40% | 1.70% |
| 2021 | 33.10% | 5.20% | 28.90% | 3.60% | 45.60% | 6.20% |
Percentage Change in Graduation Rate
IWCC 5-Year Average: +14.90%
State 5-Year Average: + 9.00%
Percentage Change in Transfer Rate
IWCC 5-Year Average: +16.00%
State 5-Year Average: + 1.90%
Percentage Change in Success Rate
IWCC 5-Year Average: +15.40%
State 5-Year Average: + 8.50%
Official Non-Credit Enrollment
| Year | Head Count | % Change | Credit Hours | % Change |
| 2024 | 5864 | -22.30% | 220524 | 9.60% |
| 2023 | 7548 | 6.30% | 201171 | 8.80% |
| 2022 | 7100 | 2.00% | 184815 | 3.60% |
| 2021 | 6963 | -10.00% | 178442 | 3.70% |
Percentage Change in Head Count
IWCC 5-Year Average: -6.70%
State 5-Year Average: -0.70%
Percentage Change in Credit Hours
IWCC 5-Year Average: +4.50%
State 5-Year Average: +4.60%
Financial Health
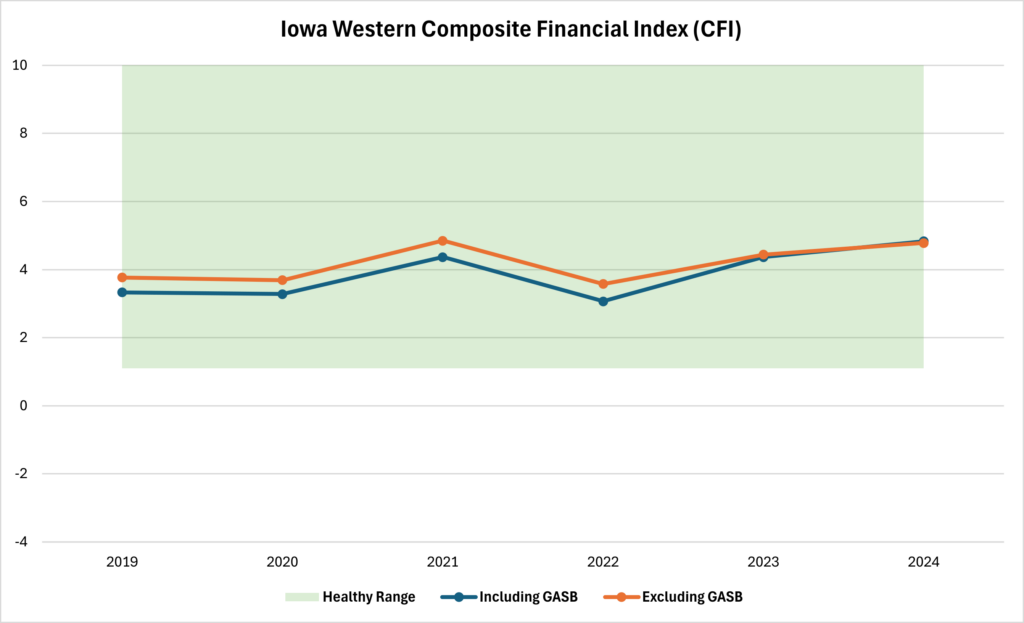
| Year | Including GASB | Excluding GASB |
| 2024 | 4.83 | 4.78 |
| 2023 | 4.37 | 4.44 |
| 2022 | 3.07 | 3.58 |
| 2021 | 4.37 | 4.85 |
| 2020 | 3.28 | 3.69 |
| 2019 | 3.33 | 3.77 |
Data Reports & Resources
External Iowa Western Data
Prepared Reports
- Economic Impact
- Student Graduate Data
- Student Retention Data
- Athletic Report 2024
- Student Enrollment Report 2024
- High School Enrollment Report 2024
- IPED Data Feedback Report 2024
Contact
For more information regarding data on this page, please contact